 I'm still not exactly sure how I got this to work. Somehow I saved the graph as a picture, then I followed Christine's advice and saved it to photoshop as a jpg. Thanks Christine. I could not get the print screen button on my keyboard to do anything.
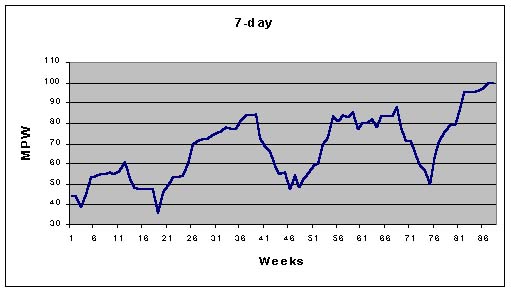
 Anyway, this is a graph of my rolling 7-day mileage since November 1st. I think it's a great visual that shows how I built my mileage for 2-3 weeks at a time, then cut back for a week before building again.

6 comments:
Holy Moly Chad, that's one heck of a chart.
aaw, now I'm feeling all inadequate....(half kidding) ;)
btw - great job on posting the chart. If you want to try the print screen thing in future, you have to press control + print screen and then paste it somewhere else.
Impressive build up. Also, I appreciate the link to the Beck article that you posted yesterday. I'm one of the many who get too caught up in how fast I'm running even when building mileage. It's always good to hear another voice remind me that there's a time for distance and a time for speed.
By the way, for me it's shift + print screen and then paste the image into a graphics program.
Interesting graph. I graph just about everything in my running log, but I haven't tried that yet. I'll have to give it a try.
One of these day's I'll also have to try an all out 440 to see if I am "average". I seriously doubt that I'll make it.
Thanks guys. I just noticed that the x-axis should be days, not weeks.
that is an awesome graph. very nice.
Post a Comment